How to Create Custom Reports in CRM
In today s data-driven landscape, learning to use and interpret information is essential for any business looking to thrive.
Custom reports within Customer Relationship Management (CRM) systems serve as a powerful tool. They allow you to tailor insights specifically to your needs, enhancing both efficiency and personalization.
This article delves into the many benefits of custom reports. It guides you through the creation process while emphasizing key features such as filtering and visualization.
You ll discover best practices and troubleshooting tips to ensure your reports achieve maximum impact. Get ready to unleash the full power of your CRM data today!
Contents
- Key Takeaways:
- Benefits of Using Custom Reports in CRM
- Creating Custom Reports
- Key Features and Functions in Custom Reports
- Best Practices for Creating Custom Reports
- Troubleshooting Common Issues
- Frequently Asked Questions
- How do I create a custom report in CRM?
- Can I customize the layout and design of my report?
- What type of data can I include in my custom report?
- How can I schedule my custom report to run automatically?
- Is it possible to share my custom reports with other team members?
- Can I export my custom report to a different file format?
Key Takeaways:
- Custom reports enhance efficiency and personalization.
- Step-by-step guides simplify the creation process.
- Best practices include effective filtering and visualizations.
What are Custom Reports?
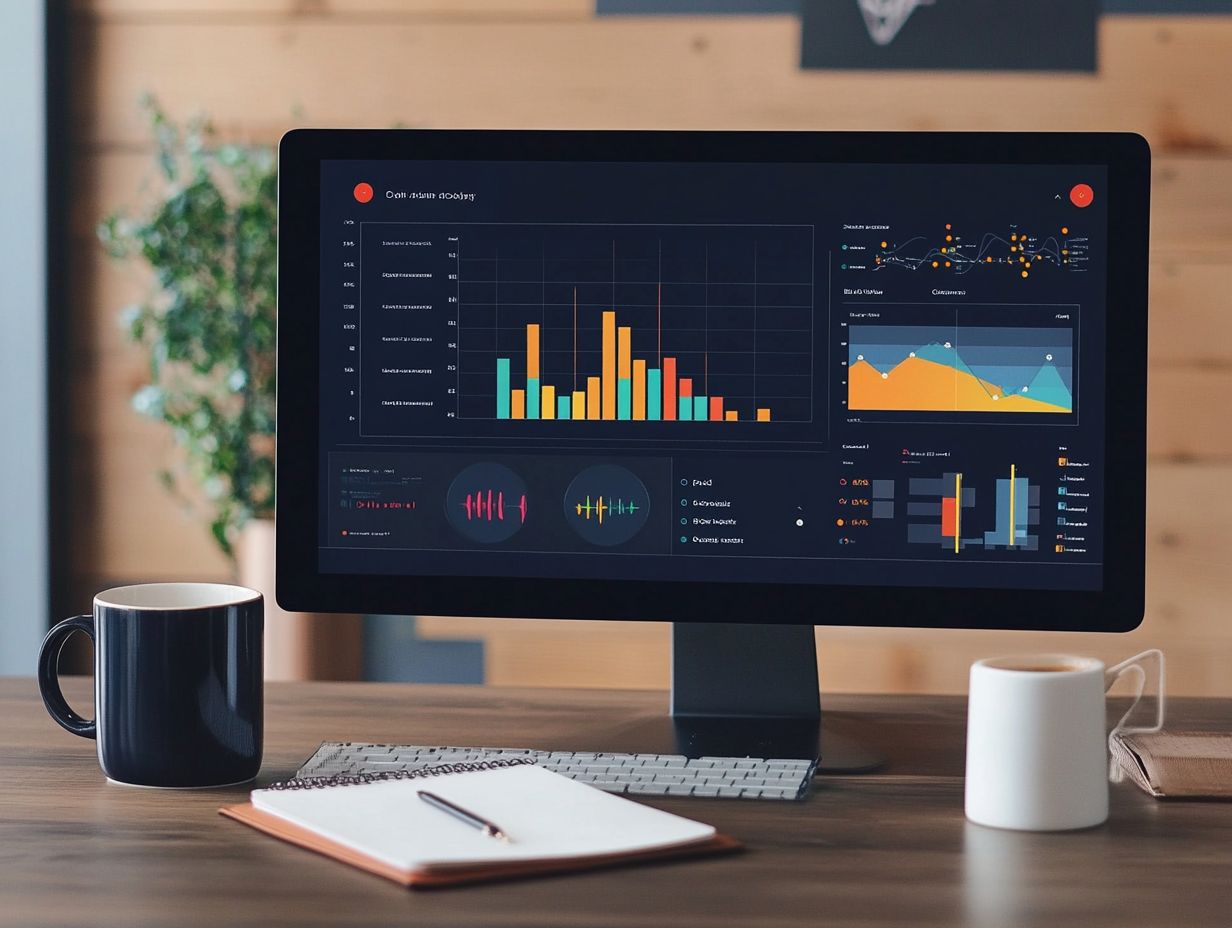
Custom reports, especially in platforms like HubSpot, allow you to craft data presentations that meet your specific needs. This elevates the visibility of key metrics such as sales activities and user engagement.
By harnessing advanced reporting tools, you can consolidate various data sources. This creates impactful visualizations that align with your objectives.
These tailored reports are essential for data analysis and give you the power to make informed decisions based on real-time insights. For example, in CRM systems, custom reports enable your team to track customer interactions, monitor campaign performance, and evaluate overall productivity.
Utilizing dashboards featuring these personalized data visualizations helps you identify trends and opportunities more effectively. This capability streamlines your decision-making process and promotes a culture of data-driven strategies. Ultimately, this enhances customer relationships and boosts profitability.
Benefits of Using Custom Reports in CRM
Utilizing custom reports within a CRM system like HubSpot gives you the power to gain tailored insights. This significantly enhances your decision-making processes.
This approach improves performance tracking and facilitates user engagement, all while addressing your specific operational needs.
With these bespoke reports, your team can dissect data and visualize performance metrics in a way that truly aligns with your unique goals.
Efficiency and Personalization
Efficiency and personalization are two key benefits of utilizing custom reports within HubSpot’s ecosystem. They allow you to tailor your reporting structures to meet your specific needs and elevate your overall productivity.
With an adaptive framework at your disposal, you can select and visualize the metrics that truly matter in your unique business context. This level of customization enhances your insights and aligns seamlessly with your strategic goals, making data-driven decision-making feel more intuitive.
When you consistently integrate personalized metrics into your workflows, you ll pinpoint trends more accurately and respond proactively to shifting market conditions.
Ultimately, this tailored approach optimizes your operational efficiency and deepens your understanding of performance. This leads to better resource alignment and improved business outcomes.
Creating Custom Reports
Crafting custom reports with HubSpot’s report builder is a sophisticated process that gives you the power to tailor reports precisely to your unique metrics tracking requirements.
This journey encompasses establishing report permissions and selecting both primary and secondary data sources. You must also carefully choose filters and visualizations to effectively convey the insights you seek.
It’s all about ensuring that your reports not only meet your needs but also present data in a way that’s both insightful and visually compelling.
Step-by-Step Guide
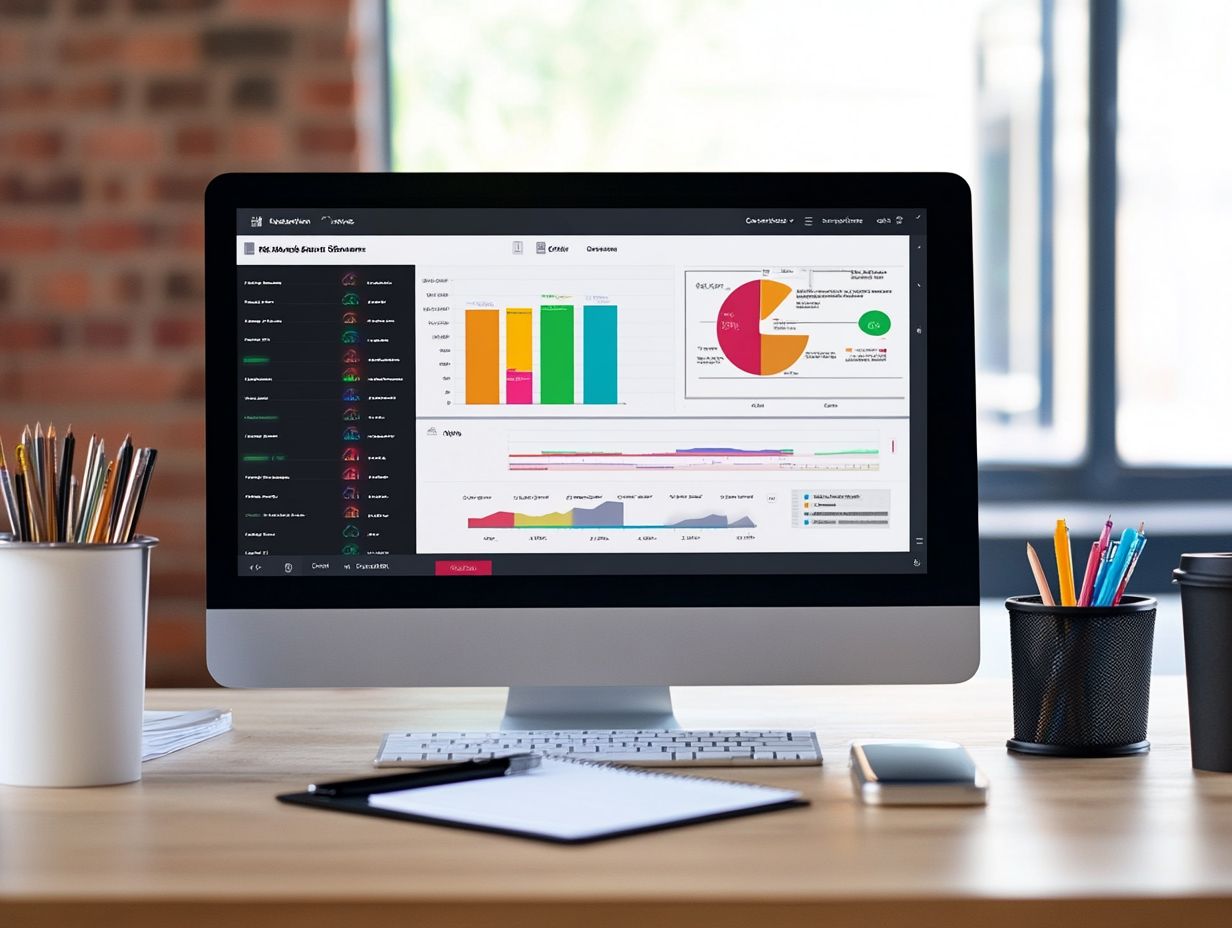
Get ready! This guide helps you easily navigate creating reports in HubSpot. It will transform your reporting process now, empowering you to generate insightful visualizations that accurately reflect your data.
Start by selecting relevant filters to narrow down your dataset. This allows you to concentrate on key metrics like revenue trends or lead conversion rates.
You can also choose the right chart type whether it’s a bar chart for straightforward comparisons, a line graph for tracking trends, or a pie chart for illustrating proportions. This will elevate the effectiveness of your report.
Finally, tweaking settings like date ranges and adding extra data points will refine your report. This helps you share your findings in a clear and attractive way.
Key Features and Functions in Custom Reports
The key features and functions of custom reports in HubSpot offer you an impressive array of options for report visualization and keeping track of important numbers.
By understanding these features, you can truly maximize the effectiveness of your reports, ensuring they deliver actionable insights and provide a clear overview of your performance.
Filtering and Sorting Data
Filtering and sorting data are essential for crafting impactful custom reports. This allows you to refine report criteria for focused insights.
With HubSpot’s robust filtering options, you can easily tailor your reports to emphasize specific metrics and performance indicators. This ensures that the data presented is both relevant and actionable.
You can apply various filters like date ranges, deal stages, or contact properties to hone in on the information that truly matters for your decision-making. This targeted approach streamlines the reporting process and enhances the clarity of outcomes.
The sorting options allow you to arrange data in a hierarchy or sequence that aligns with your analytical needs, making it easier to draw meaningful conclusions.
Ultimately, leveraging these capabilities within HubSpot ensures that you can access the pertinent details you need, empowering every report to drive informed strategies and elevate performance.
Visualizations and Charts
Visualizations and charts are essential components of your custom reports. These allow you to present complex data in a format that s both engaging and easily digestible.
With HubSpot’s diverse chart types, you can effectively convey your findings, making it simpler for stakeholders to grasp trends and performance metrics at a glance.
The platform equips you with an impressive range of tools, including bar graphs, pie charts, and line graphs each tailored to showcase different datasets in a visually striking way.
Bar graphs are particularly adept at comparing quantities across categories. Pie charts beautifully illustrate proportions and percentages, providing a clear visual representation of parts in relation to a whole.
Line graphs shine when it comes to displaying data trends over time, enabling you to pinpoint patterns and make informed predictions about future outcomes.
By harnessing these varied visualizations, you can elevate your reports, transforming them into not just informative documents but also engaging narratives that promote better data-driven decision-making.
Best Practices for Creating Custom Reports
Implementing best practices for crafting custom reports in HubSpot can greatly elevate the effectiveness of your data presentation.
By following these guidelines, you can ensure that your reports deliver actionable insights tailored to your operational goals and account requirements.
This approach not only optimizes your reporting process but also empowers you to make more informed decisions backed by relevant data.
Start creating your custom reports today and unlock the insights your business needs!
Tips for Maximizing Effectiveness
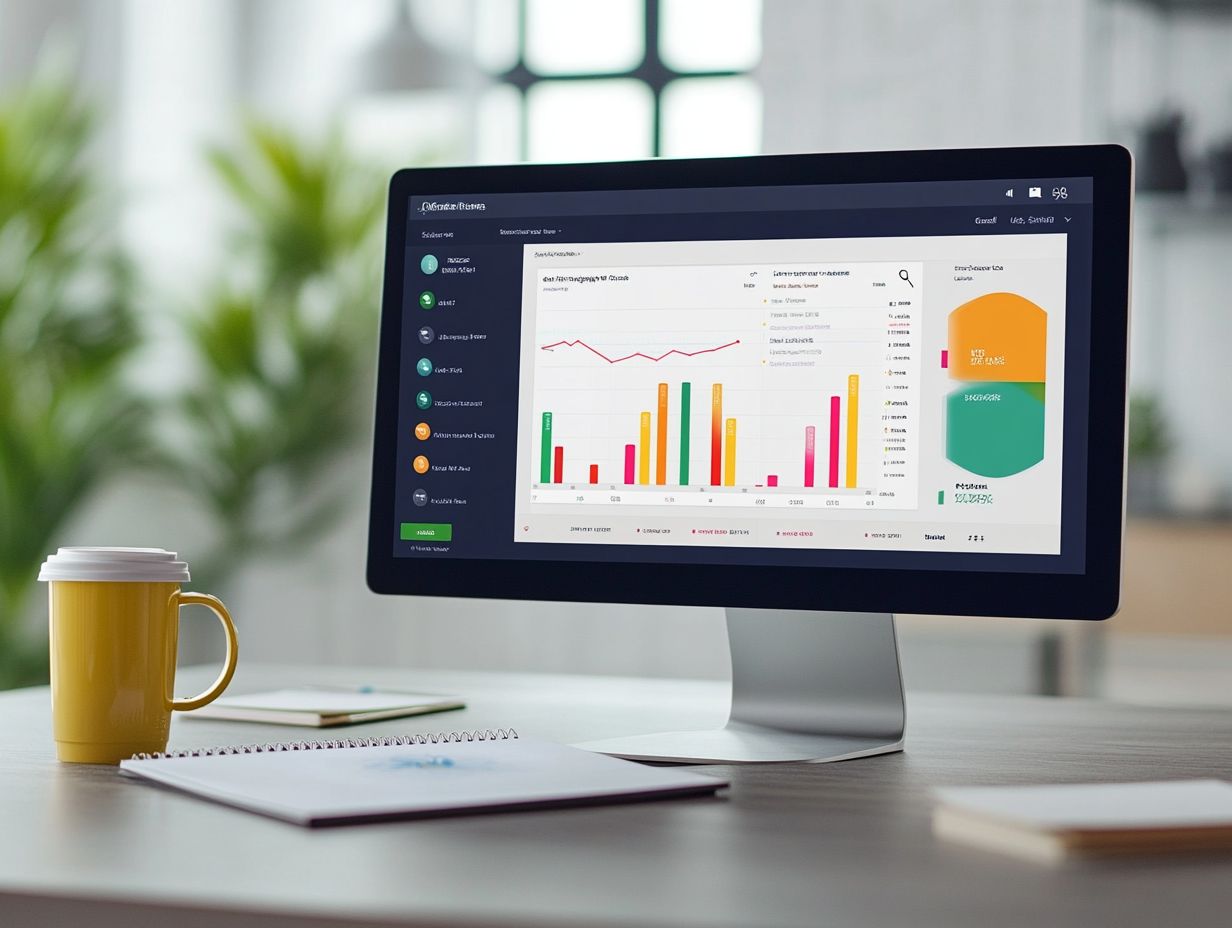
Unlock the full power of your custom reports in HubSpot today! It’s crucial to weave in user feedback and focus on the metrics that matter most. By understanding your users’ needs and tailoring reports to their objectives, you can ensure the insights provided are not just insightful but also actionable and powerful.
This means regularly gathering input from end-users who rely on these reports for decision-making. Create a collaborative atmosphere where their perspectives influence the final product. Analyzing current metrics helps you identify gaps or redundancies in your data, allowing you to refine your reporting strategies effectively.
Establishing a seamless process for collecting feedback whether through surveys, workshops, or informal discussions helps you improve constantly. Implement these strategies to enhance the clarity of your reports and elevate overall engagement, leading to more informed decisions that closely align with your business goals.
Troubleshooting Common Issues
Troubleshooting common issues with custom reports in HubSpot is essential for maintaining optimal performance and ensuring accurate data representation.
By addressing these challenges promptly, you enable yourself to leverage historical data effectively, making informed decisions based on insights derived from your reports.
How to Fix Errors and Improve Performance
To fix errors and enhance performance in your custom reports within HubSpot, take a systematic approach to review your data measurements and report settings. By identifying potential errors and adjusting configurations as needed, you can ensure your reports deliver accurate and actionable insights.
This process includes meticulously checking the validity and relevance of your data sources and ensuring that your metrics align with your analysis goals. You can further refine your custom reports by implementing filters that eliminate outliers and irrelevant information from your data set.
Utilizing HubSpot s built-in analytics tools will help you visualize your report’s performance, allowing you to quickly identify trends or anomalies. Regularly auditing your report settings is crucial; it helps maintain consistency and reliability over time, ultimately leading to more fruitful decision-making processes.
Frequently Asked Questions
How do I create a custom report in CRM?
To create a custom report in Customer Relationship Management (CRM), follow these steps:
- Go to your CRM’s reports section.
- Click the “New Report” button.
- Select the type of report you want to create (e.g., sales, marketing, customer service).
- Choose the data fields and filters for your report.
- Save your report and give it a unique name.
- Run the report to view your customized data.
Can I customize the layout and design of my report?
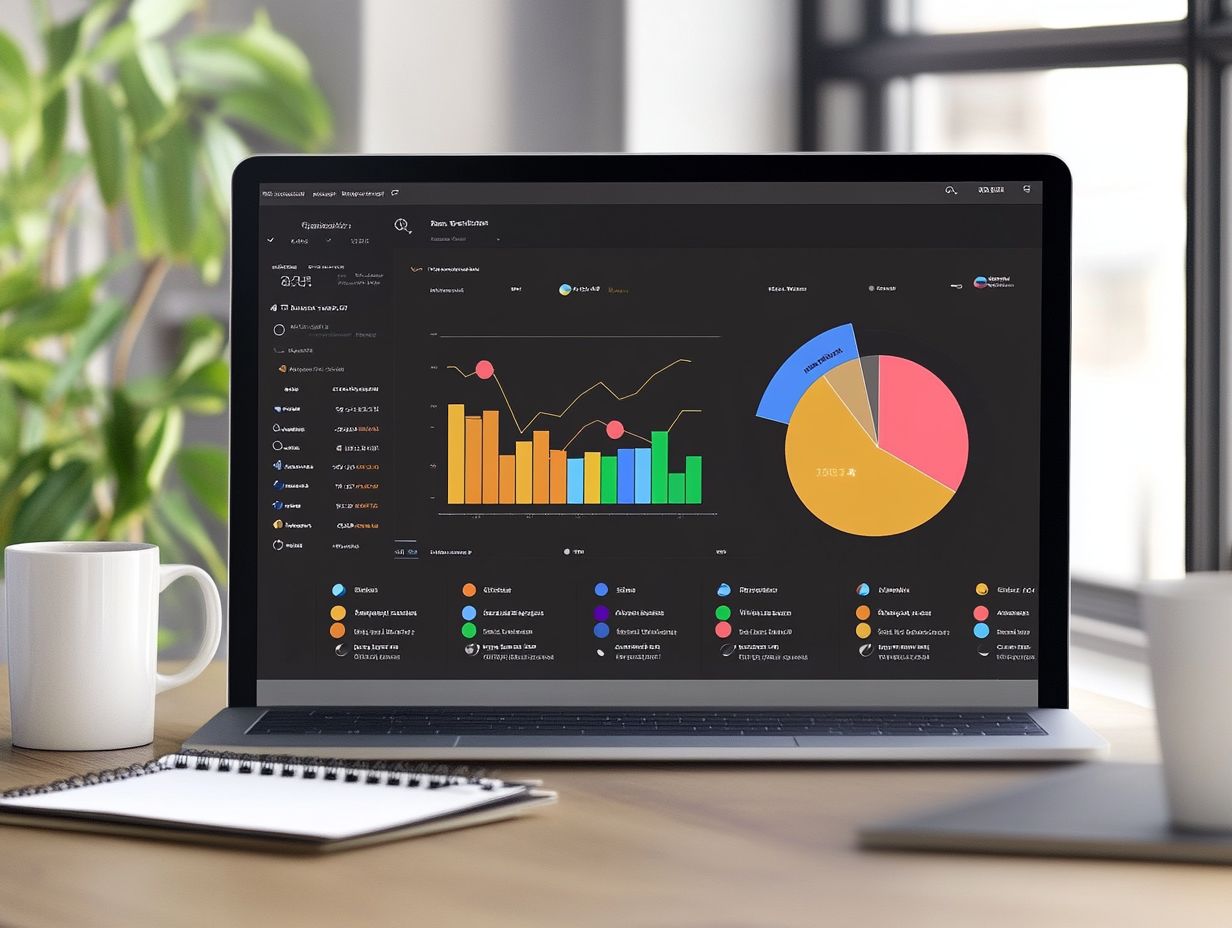
Yes, most CRM platforms offer options to customize the layout and design of your reports. You can choose the colors, fonts, and data visualization tools to make your report visually appealing and easy to understand.
What type of data can I include in my custom report?
You can include any data stored in your CRM, such as customer information, sales data, marketing metrics, and customer service performance. You can also include data from integrated apps or external sources.
How can I schedule my custom report to run automatically?
Most CRM platforms allow you to schedule your custom reports to run automatically at specific intervals (e.g., daily, weekly, monthly). This saves you time and ensures you always have updated data at your fingertips.
Yes, you can share your custom reports with other team members or departments within your organization. You can also set permissions to control who has access to view, edit, or run the report.
Start creating your custom reports now!
Can I export my custom report to a different file format?
Most CRM platforms let you export your custom report in formats like PDF, Excel, or CSV.
You can quickly share the report with people who need to see it or use the data for further analysis.
